I wanted to write a short introduction to a tool that I’ve been using a lot on my newest servers and development projects. This tool seriously provides the most amazing way of monitoring and comprehending your server’s performance and other metrics that I’ve seen in such a simple, lightweight installation.
Here’s the current RAM utilization of my server, thanks to netdata:
![]()
From the readme:
netdata is a system for distributed real-time performance and health monitoring. It provides unparalleled insights, in real-time, of everything happening on the system it runs (including applications such as web and database servers), using modern interactive web dashboards.
netdata is fast and efficient, designed to permanently run on all systems (physical & virtual servers, containers, IoT devices), without disrupting their core function.
netdata runs on Linux, FreeBSD, and MacOS.
There is a demo available at http://my-netdata.io
Why I love netdata:
If you didn’t skip right to the demo and instead feel like reading, here are some of my favorite things about netdata.
- I might steal some things from their GitHub page, such as fancy GIFs xD
1. Automatic installation.
If you have Arch, Gentoo, or Solus Linux, you can use your package managers (pacman, emerge, eopkg)
Otherwise, there is an installation script which will try to install the dependencies on most major Linux distributions and then install netdata without any hassle.
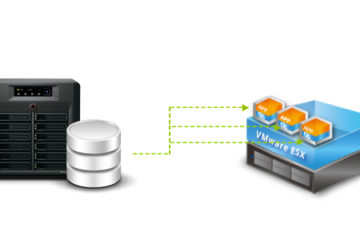
2. Synology NAS support
You can monitor the metrics of your Synology NAS too, with debian chroot + the netdata components.
3. Beautiful interface:
Words… need not.

4. No configuration required
Usually when you set up some sort of monitoring system, there’s at least one configuration you’ll have to do. Sometimes, you even have to define all the metrics you would like it to collect.
Not with netdata! According to their GitHub page, it can automatically collect up to 5000 metrics per server out of the box.
5. Monitors everything important
I like to check my CPU use, memory utilization, disk info, network stats, fail2ban bans, and more. This makes it impossibly simple.

Just install it, and you can see it all.
6. Application support
Aside from monitoring the usual hardware and OS stats, it can also monitor applications. This is an extensible feature, so if it doesn’t monitor an application you use today, it may support it tomorrow.

7. It’s FAST.
I can’t say anything more… this isn’t a clunky interface. It doesn’t hog your resources on the server OR the client. And it’s all on a single page.
8. It’s popular
netdata is becoming increasingly popular in the community, and the development is constantly advancing. I’m all for projects that are maintained.
Check out netdata on GitHub or at their website.
I hope you try netdata and can enjoy using it. netdata is a priceless utility.


0 Comments